


It is important for a project manager to be aware of how things are going in the project and to be able to take appropriate corrective actions when it is needed. However, keeping up with each and every team member and tracking the team's capacity is a time-consuming process, and sometimes a lot of significant information for the manager: a person’s workload, team workload, the total number of hours planned per each project, an amount of logged work, etc — can be lost.
What is a Team's Capacity?
Before delving into Jira team capacity planning and Activity Timeline Reports, it's crucial to have a clear understanding of team capacity.A team's Capacity is the maximum amount of work that can be completed within a given time frame and it relies on how many hours a group has available to complete that work.There are a number of advantages to using capacity: better resource planning & management, work-life balance, and prevention of burnout - as a result, the completion time for a project can be fairly estimated in advance.
How to Calculate Team Capacity?
Before resource planning activities you need to know the next data:
- Iteration period
- Number of workdays in this period
- Number of Team members
- Meetings or another project activity when the person will not be involved in the work
- Planned days off, vacations, or holidays for every member
Let’s see how to calculate Team Capacity. For example, your team has a one-week Sprint. It’s 5 working days, 40 hours per week. Everyday team has 2 meetings, it’s 10 hours per week. Your team members have 3 employees: the first member has an availability of 40 hours, the second member has an availability of 32 hours, and the third member has an availability of 28 hours.Team Capacity = (40+32+28)-10. 90 person-hours are available for the whole team.
Team Capacity Planning in Jira
Jira is an industry-leading project management and issue-tracking platform that helps teams to collaborate on different levels.It serves as a centralized platform for teams and organizations. Its primary purpose is to foster collaboration and organization throughout the entirety of a project's lifecycle. By providing a diverse set of features and functionalities, Jira empowers users to efficiently create, assign, and prioritize tasks while keeping track of their progress in real-time. Moreover, Jira's flexible nature allows users to tailor the software to their unique workflows and processes, making it an adaptable and versatile tool.Jira mainly concentrates on projects and tasks, but it has a variety of reporting plugins, like ActivityTimeline, that can help you with the resource management and capacity planning process.
Capacity Planning with ActivityTimeline
ActivityTimeline is a resource planning and tracking add-on for Jira that helps to advance your resource management capabilities. It ensures an effective capacity planning process as it provides a special dashboard with the user's tasks and projects, and the ongoing/planned activities visible on user/team timelines.It also provides the personal workspace, timesheets, and reporting section for top resource capacity planning.For starting a plan, you need to operate with a time iteration: by week, by two weeks, or by month. If you are a Scrum team it is a Sprint. In the planning meeting (Sprint planning), the product owner and team members determine how much work can be done in a single sprint. Capacity is determined by either a percentage of time or a number of story points. When you represent team capacity in the timeline, Workload Panel will display current capacity and bring attention to how work is distributed across weeks or Sprint time periods.
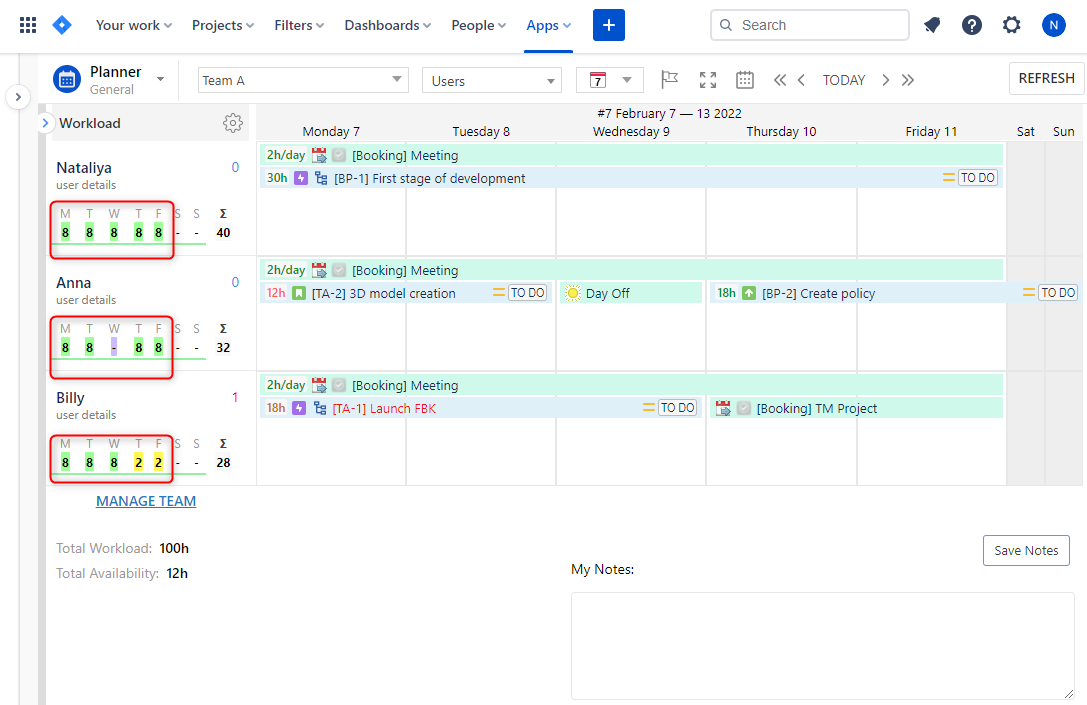
Project Managers enjoy effective team capacity planning with ActivityTimeline, as it provides a Team Panel where you can find timelines developed for each team. They're very useful when you need to assign a large scope of work to the entire team (like epics or program increments) and for long-term team capacity planning. Team timelines also have workload indicators for each team.In order to make the team capacity process easier, we included a Reports feature to the ActivityTimeline, which will help them keep a check of all these things without putting in much time or effort.
Team Capacity Reports with ActivityTimeline
To give you a quick overview of what we’ll go through in this post, here are the three types of reports for teams we will tell you about:
- Planning Reports
- Time Sheets Reports
- Tracking Reports
Resource Planning Reports
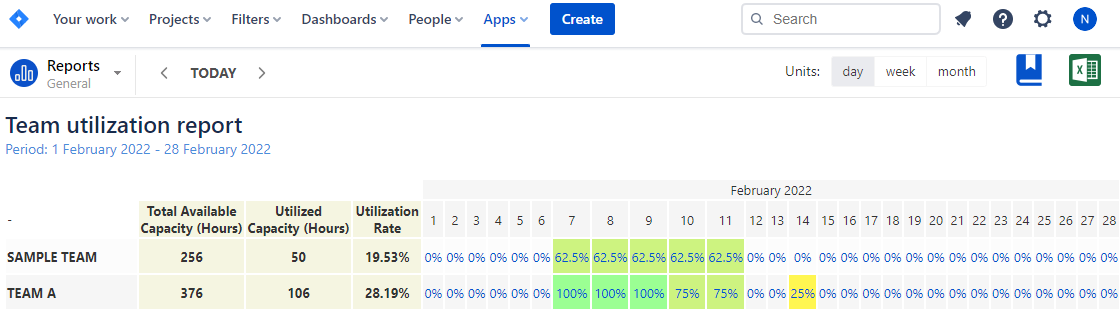
These reports display the planned workload based on the Remaining Time Estimate of scheduled Jira tasks and custom events. There are reports type available: workload for each employee, per team and project, and their respective summary variants. Extra reports display the availability of people in particular teams or positions (per skills) at a point in time.Team Utilization Report – this type of report will help you ensure that your team members are scheduled to work on the project to use their full capacity. You can check available capacity, and utilized capacity for the team. ActivityTimeline automatically calculates the utilization rate for every team.
Availability Reports – a set of reports that display the availability of people per particular team, skill, or employee position in the future. The green color corresponds to full utilization. Negative numbers show overloaded periods.

Timesheet Reports
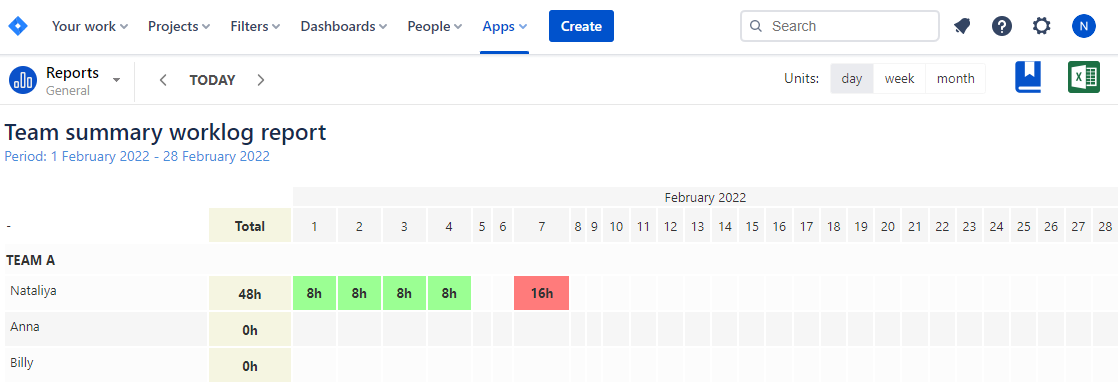
Timesheet Reports— a set of reports generated based on the amount of work done (number of hours logged by people in a team). ActivityTimeline allows the inclusion of bookings or non-working days in the calculation.What does it include:Team Summary Work Log Report lets you know the amount of logged work during the course of a particular period of a month and also the person logged into the work.Team Detailed by Issue Work Log Report — shows Jira tickets, in which the amount of work done was logged for those tickets.Team Detailed by Project Work Log Report brings into being a report on which projects the work is logged for, against time.
Tracking Reports
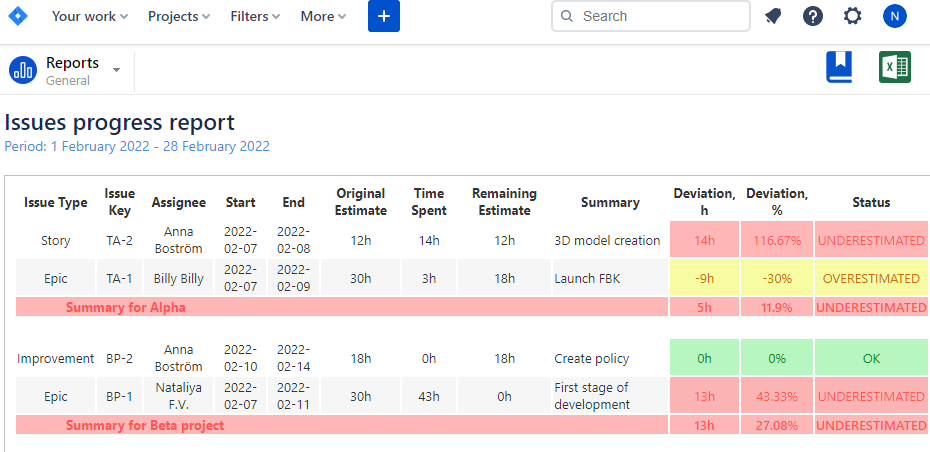
Tracking Reports — a set of reports generated based on the time planned and time spent on specific Jira tickets for a defined period of time, and time off.Why it is useful for PM:Issues Progress Report or Project Progress Report builds a summary of Jira tickets, time estimates (original and remaining), time spent already on the tickets, and ticket status. A report represents the collected data about Jira tickets, a person who was the last assignee, Start and End Dates, Original and Remaining Estimates, Time Spent (logged work), Issue Summary, and Status. In this report, you can set a deviation percentage that is acceptable. The report displays the status for every project: is a project overloaded, underloaded, or the project is perfectly estimated.
Planned vs Logged by Team – it’s an Excel report where you can compare your planned workload with actual logged hours.

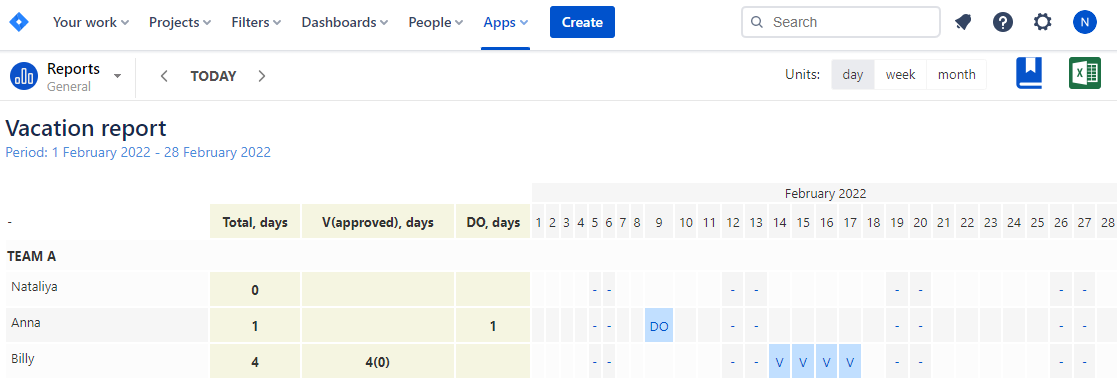
The Vacation Report gives information about vacations, days off, sick leaves, and holidays per each team member.
How to Use Reports for Team Capacity Planning
In every report, you can see the visualized results of the current capacity. All data (hours) are displayed in a different color. Cells are yellow or red if days are overloaded or underloaded accordingly. The data could be displayed in percentages. Estimate team capacity and resource availability.Review your capacity to ensure that you are not overbooked. The capacity view will highlight in red the overbooked portion. This is helpful when you are planning your sprint and want to ensure that all team members are accounted for.When assigning work to individual team members, be sure to take into account their current workload. Overtaxing team members can lead to decreased productivity and potential burnout. The Capacity view in the Team panel will help you to identify when overall capacity is not balanced. Capacity reports will help to summarize the results.If you want to add a new project or workstream to your schedule, use the capacity view to determine if you have the available resources. This view quickly shows you which teams have free slots, so you can plan accordingly.
Capacity Planning Strategies
After gathering an ample amount of data, the next step is to analyze the reports in order to efficiently handle team capacity. Below are several capacity planning strategies to consider when examining the reports:
Identify Capacity Constraints
Review the workload distribution across team members and identify any team capacity constraints. Look for individuals who are consistently overloaded or have significant gaps in their workload. By identifying these constraints, you can take proactive measures to balance the workload and prevent burnout.
Allocate Workload Efficiently
Based on the insights from the Activity Timeline Reports, you can allocate tasks and assignments more efficiently. Consider the skills, availability, and workload of each team member to ensure a balanced distribution of work. This strategy helps to optimize productivity and prevents overburdening specific individuals.
Optimize Team Performance
Identify patterns and trends in the Activity Timeline Reports to identify areas where team performance can be improved. Look for bottlenecks, delays, or dependencies that hinder productivity. By addressing these issues, you can enhance team performance and streamline project execution.
Track Progress and Identify Dependencies
Track the progress of tasks and milestones using the Activity Timeline Reports/Timesheets. By monitoring dependencies and deadlines, you can identify any tasks that are causing delays or impacting other team members. This allows you to take corrective actions and keep the project on track.All of the tips use data from Activity Timeline. We’d love for you to give it a try for free if you haven’t tried it before. Discover more useful information about ActivityTimeline features, Schedule a Demo, or Start a Free Trial on the Atlassian Marketplace!
Conclusion
To summarize, the capacity planning process plays a crucial role in ensuring project management success. It empowers project managers to allocate resources effectively, maintain workload balance, and meet project requirements while mitigating risks and maximizing productivity. Through thorough analysis of historical data, accurate forecasting of future demands, active collaboration with stakeholders, and identification of resource constraints, project managers can make well-informed decisions and develop robust capacity plans.
FAQs
In Jira, what does "team capacity" refer to?
In Jira, "team capacity" refers to the collective amount of work a team can handle within a specific timeframe. It represents the team's available resources, including the number of team members and their availability, to estimate and plan the amount of work that can be accomplished.
What is the process for generating a capacity report in Jira?
Jira provides various reports, but to generate a capacity report users need to use special resource planning and capacity planning tools like ActivityTimeline or others.
Is it possible for Jira to calculate capacity?
Yes, Jira has the capability to calculate capacity. It provides features and various types of capacity planning software that allow users to define and track team capacity, considering factors such as available working hours, team members' availability, and workload distribution. This enables effective resource planning and workload management within Jira.

