


Key takeaways
- A Jira dashboard is a page of gadgets, and each gadget shows the result of a Jira filter, so a good dashboard starts with good saved filters.
- For project management, eight gadgets cover most needs: Filter Results, Created vs Resolved, Two Dimensional Filter Statistics, Pie Chart, Sprint Burndown, Sprint Health, Average Age and Activity Stream.
- Share the dashboard with the project or a group; each viewer sees only the issues they have permission to see.
- A dashboard shows the state of issues, not people: it won't tell you who is overloaded next week or who is on holiday.
- ActivityTimeline adds that people view on top of Jira: a timeline of who works on what, workload per person, time off and timesheets. You can try it free for 30 days.
Every Monday the same questions come up: what's late, what's blocked, what got done last week, and is the release still on track. If you answer them by clicking through boards and filters, a Jira dashboard puts the answers on one page that the whole team can open.
Here's how to build one for project management, which gadgets are worth the space, and where a dashboard stops being useful.
What is a Jira dashboard?
A Jira dashboard is a customizable page made of gadgets: lists, charts and counters. Each gadget pulls data from a Jira filter or a project, so the dashboard updates itself as issues change. Every user has a default system dashboard, and anyone with permission can create their own and share it.
How do you create a Jira dashboard?
- Save the filters first. In the issue search, write the JQL for each question, for example project = CHK AND status != Done AND duedate < now() for overdue work, and save it as a filter with a clear name such as CHK Overdue.
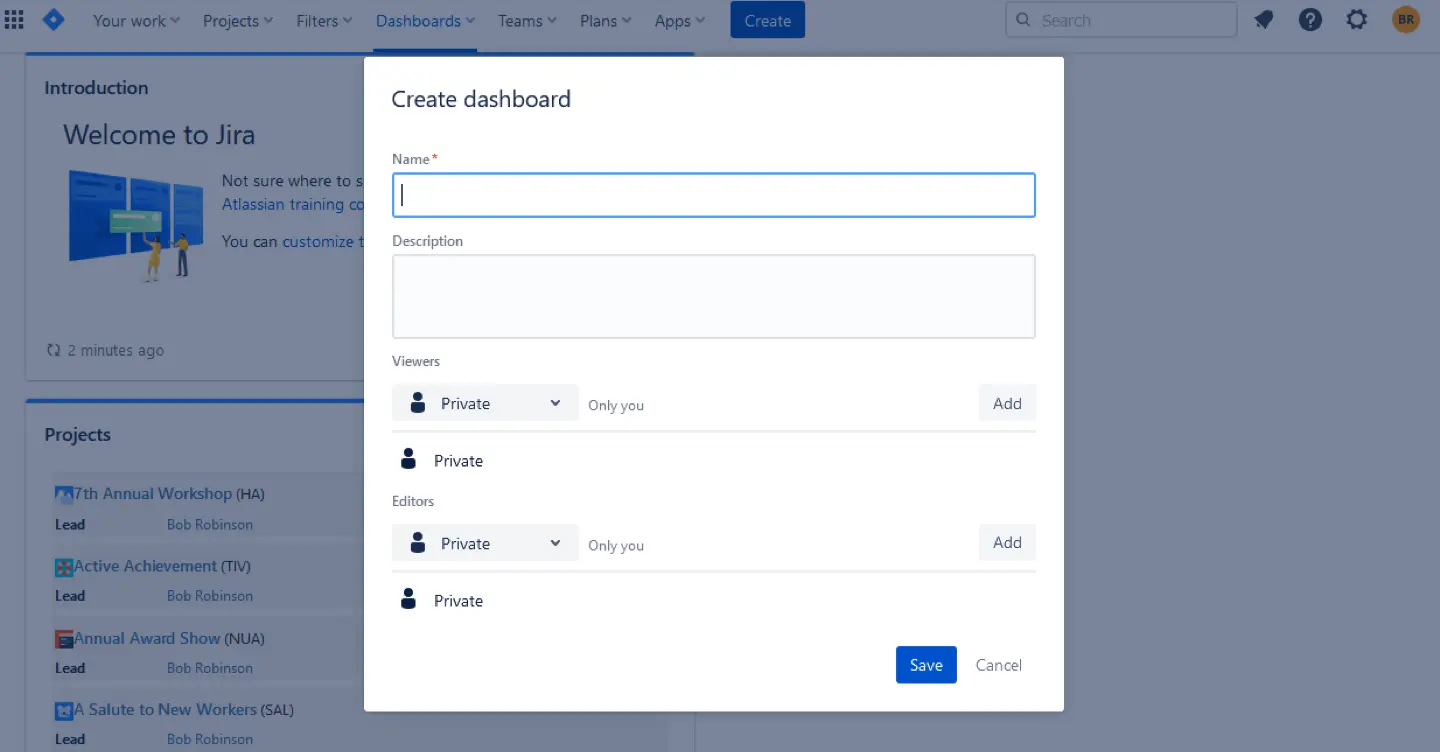
- Go to Dashboards → Create dashboard.
- Name it, for example Checkout project, weekly, and choose who can view it: the project, a group or specific people.
- Pick a layout. Two or three columns works for most project dashboards.
- Click Add gadget, search for the gadget, and point it at one of your saved filters.
- Drag gadgets so the questions people ask first sit at the top.
Which gadgets should a project dashboard have?
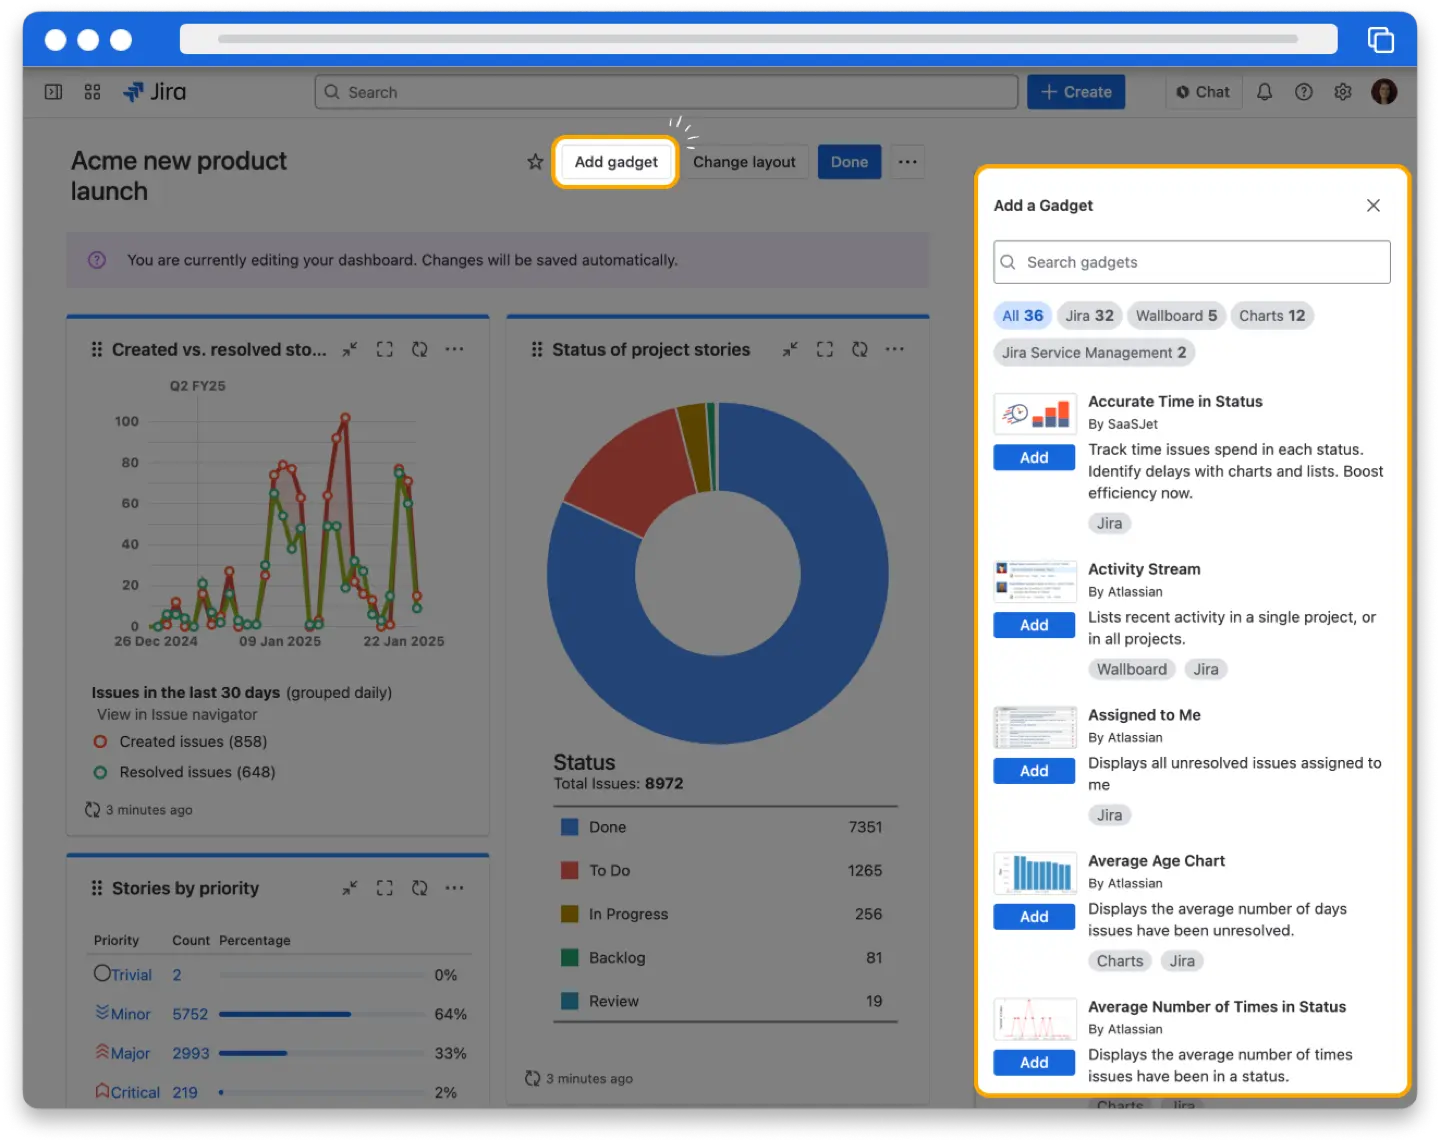
Two tips. Keep each dashboard to one audience; a team dashboard and a leadership dashboard answer different questions. And keep it under ten gadgets, because a dashboard nobody can read at a glance gets ignored.
What can't a Jira dashboard show?
A dashboard counts issues. It doesn't plan people. The Two Dimensional Filter Statistics gadget can tell you Maria has 14 open issues, but not whether those 14 issues fit into her next two weeks, that she's on holiday on Thursday, or that Alex has nothing scheduled after Wednesday. It also has no view of time spent per person across projects beyond simple totals.
How does ActivityTimeline add the people view to Jira?
ActivityTimeline is a Jira app that reads the same issues and shows them per person on a timeline:
- Planner: every team member is a row, their Jira issues are bars on the days they'll work on them, and you plan by dragging.
- Workload: each day shows how full a person is. Green means fully planned, red means overloaded, blue means out of office.
- Time off and holidays: vacations, sick days and public holidays sit on the same timeline, so the plan accounts for them.
- Timesheets: time spent per person, project, epic or Jira filter, with Excel export.
- Milestones: releases, sprints and due dates on top of the timeline.
Use both: the dashboard for the state of the project, ActivityTimeline for who is doing it and when.
FAQ
What is the best Jira dashboard for project managers?
One built around the questions you ask every week: overdue work, backlog trend, sprint progress and open work per person. Gadgets like Filter Results, Created vs Resolved, Sprint Burndown and Two Dimensional Filter Statistics cover most of it, each pointed at a saved filter.
Can a Jira dashboard show multiple projects?
Yes. Gadgets use filters, and a filter can include several projects, for example project in (CHK, PAY). Anyone viewing the dashboard sees only the issues they have permission to see in those projects.
Can I see team workload on a Jira dashboard?
Partly. Two Dimensional Filter Statistics shows open issues per person, but not hours, days or time off. For workload per day, including vacations and holidays, you need a planning app such as ActivityTimeline.
Who can see my Jira dashboard?
Only the people you share it with: specific users, a group, a project or everyone in the site. Even then, each gadget shows only the issues that viewer has permission to see.
If your dashboard tells you what's late but not who can pick it up, try ActivityTimeline on your own Jira for 30 days. Start the trial


