


Successful planning always needs proper evaluation of the workflow, previous or current. With a clear understanding of the process, team leaders can set future objectives and time frames as reports show the results of the performed work. Reporting solutions and planning are going hand in hand, so we want to cover several of the best Jira reports for your efficient planning, how to use them, discover alternatives like ActivityTimeline, and tell more about additional reports.
Reports in Jira
Reports in Jira allow users to facilitate agile and business teams and help to analyze previous work, track their tickets and time, and forecast future undertakings. There are many useful reports for Jira users available.
Jira offers crucial insights into Agile methodologies such as Agile Kanban and Scrum, so data-driven decision-making is a top-quality option in any business environment. If you work for Jira it will make your reporting a daily task. If you’re not familiar with Jira yet and you have just started using it, this is an easy way to get started.
An Overview of the Basics of Using Reports in Jira
Gathering data and using it to make informed decisions is an integral part of any successful project. Jira provides users with a variety of reporting options that can help teams analyze the progress made in their projects, track time and tickets, forecast future activities, and manage resources effectively - all of which contribute to effective planning. Here are the basics of using reports Jira offers:
- Select the Report Type: Jira provides powerful reporting tools for a variety of report types, including sprint reports, issue reports, cumulative flow diagrams, and more. Choose the type of reports that best suits your needs.
- Gather Data: Next, you will need to gather all relevant data needed to create your desired report in Jira.
- Configure Your Report: Once you have gathered all the necessary data, use Jira's report configuration wizard to customize your report.
- Generate Results: Now you can generate the report results in a web or xls format.
- Summarize Results: Once your report is generated, take some time to review and summarize the data provided so that it's easier to interpret by other users who may view the final version report.
The Value of Jira Reports
Jira reports helping you keep an eye out for the sprint goal process. Reports are an easy and quick means to track your progress.During the work, there are a few possible questions your colleagues might ask. For example: Is it possible for sprints to complete more than 80% more tasks? How many resources do we need to complete the plan? Is the variability consistent with your forecasts? Do you believe the time is right to deliver the product? To have such answers manager needs to analyze the data from the project.
Most Important Features of Jira Reports
Customizable Dashboards
Reports in the system Jira allow users to create dashboards with multiple view options, enabling a deeper understanding of project performance.
Data Filtering and Sorting Options
The reporting tool in Jira provides flexible data filtering and sorting features based on specific criteria such as dates, labels, or components for easy analysis.
Shareable Reports & Visualizations
With the help of Jira's report generator, users can easily share their generated reports via email or other channels making it easier for teams to collaborate effectively on tasks assigned within the project timeline.
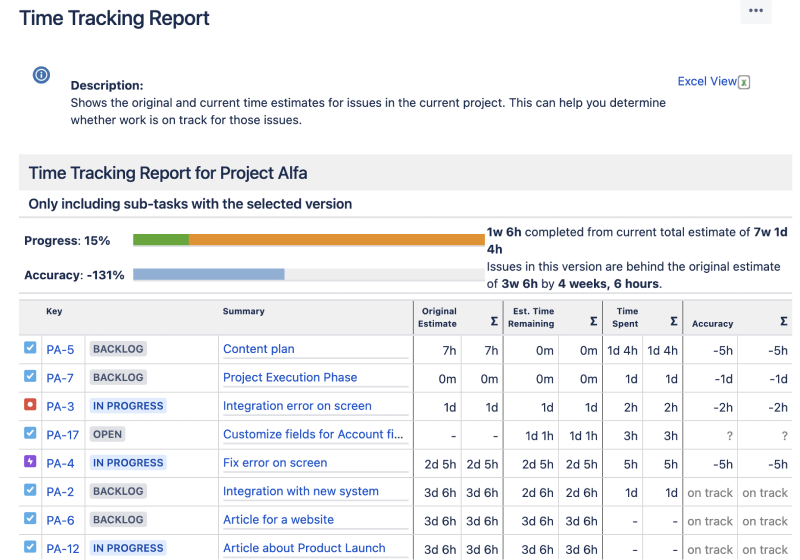
Time Tracking & Estimates
Reports provide powerful tools to help teams keep track of time spent on various activities such as development, design, or testing so that they can better estimate future task duration based on past data.
Alternatives and Options for Jira Reporting
Jira Reports
Jira offers a range of reports that can be built from the data stored in Jira. These include various types of charts, burndowns, and filterable tables to help you get the most out of your information.
Pros:
- The most basic and flexible
Cons:
- Requires more technical knowledge to build reports with accuracy
- Can be complex to understand results without in-depth analysis
Plugins
There are several add-ons available for Jira which allow users to create specific reports such as velocity reporting and planned vs actual reports, or reports in more comprehensive tools like ActivityTimeline that enable visualizations around development progress and project health.
Pros:
- Easy to use and configure
- Time-saving features such as automated reporting
- A large selection of reports
Cons:
- Plugins require more time to choose and learn a new system
- Some plugins are not free or may be difficult to find the best one for your needs
Third-Party Tools
You can try several third-party tools that provide comprehensive Jira reporting capabilities, for example, Power BI (Microsoft). These offer a number of out-of-the-box dashboards to help you quickly spot patterns in your data.
Pros:
- Custom report are easily to set
- Easy to setup and use
Cons:
- Can be costly, especially if you need multiple users to access the same report
Types of Reports in Jira Software
Jira provides 4 main types of reports generated in Jira in these reporting categories – Agile, DevOps, Issue analysis, Forecast & management, and others.

Agile
An Agile report in Jira typically provides insights into the progress of the project and future performance indicators that can be used to optimize processes and continuously improve them.Depending on what team you have there is an available a certain set of reports. For the Kanban team, Jira provides a few reports in the Agile section. For Scrum teams, Jira offers different reports based on who manages the team: the company or the team itself. If your project type is Company-managed software then Jira provides a wider range of reports. For the Team-managed software type, there are fewer reports. But the last type is hidden by default. To enable the reports, the user has to select a Specific Project → choose Project Settings → Features → Turn on the Reports switch.
DevOps
A DevOps reports typically provide insights into how quickly changes are being deployed, and how effectively these deployments are managed. As an example, the Lead Time for Changes chart provides an indicator of overall change velocity and any potential bottlenecks that might be causing delays.
Issue analysis
An Issue analysis report in Jira is a tool for understanding how quickly issues are being resolved. The reports typically provide insight into the average resolution time, issue status, and priority, as well as any potential bottlenecks that might be causing delays. An example is the Resolution Times by Issue Type and Priority chart.
Forecast & management
A Forecast & management report in Jira is a tool for measuring the overall progress of a project. They typically provide insight into how well tasks are being completed, as well as any potential bottlenecks that might be causing delays. An example of this kind of report would be the Cumulative Flow Diagram (CFD) chart which tracks how work items move through different stages throughout their lifecycle. Other best Jira reports examples include Cycle Time Scatterplots (tracking average lead times), and Portfolio Epic Progress Bars (showing relative completion against milestones).
How do I see and enable reports in Jira?
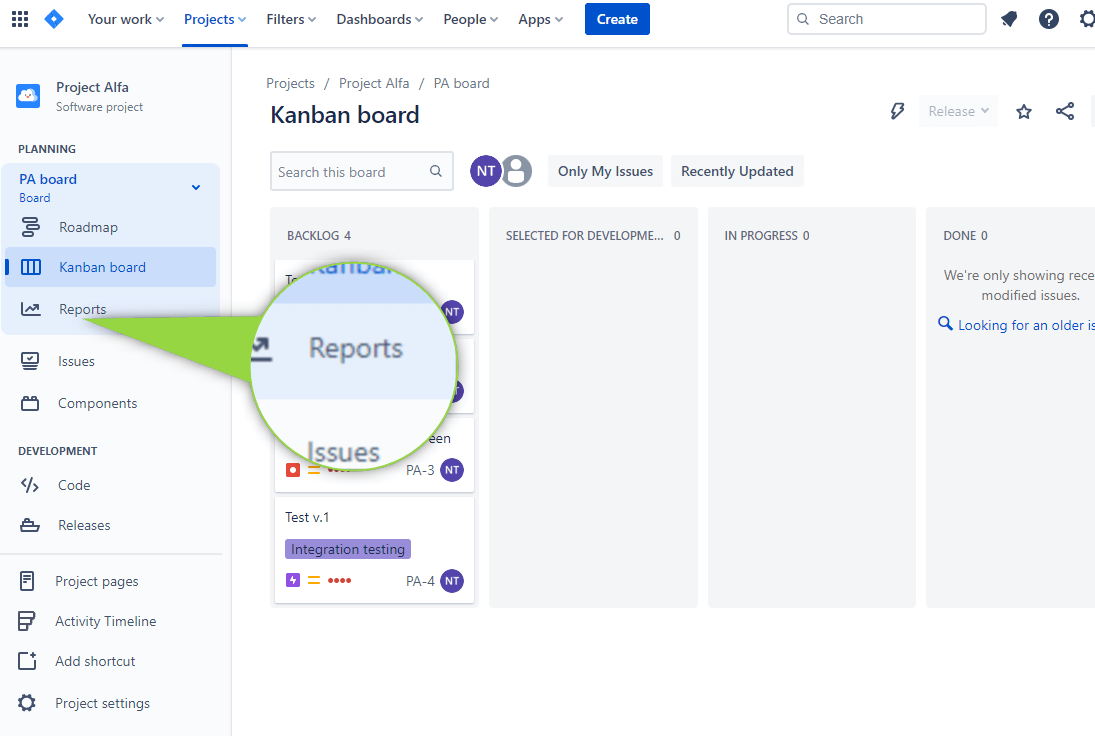
To view Jira reports, users have to select a Specific Project → to choose Your project → Reports. Click the Report icon at the top left. It displays every report supported by Jira. This picture shows you the easiest and simplest way of accessing specific projects.
Most Popular Reports in Jira
Burndown Chart in Jira
Burndown Chart in Jira allows for predicting whether the team will finish its work in time. It shows the amount of completed and remaining work during the sprint or epic. Moreover, it helps to inform the team about the changes in the work scope.
These charts facilitate the analysis of the teams' work. For example, with the help of the chart, you can see that team is always finishing its work very quickly and the main concern may be that team members take less work during the sprint planning than they should take.But the situation may be vice versa. If a team is always late and cannot complete tasks in time, it means that members are overloaded and this issue must be fixed. When you have rapid falls in the diagram it means that work was not evenly distributed and it was evaluated in the wrong way.
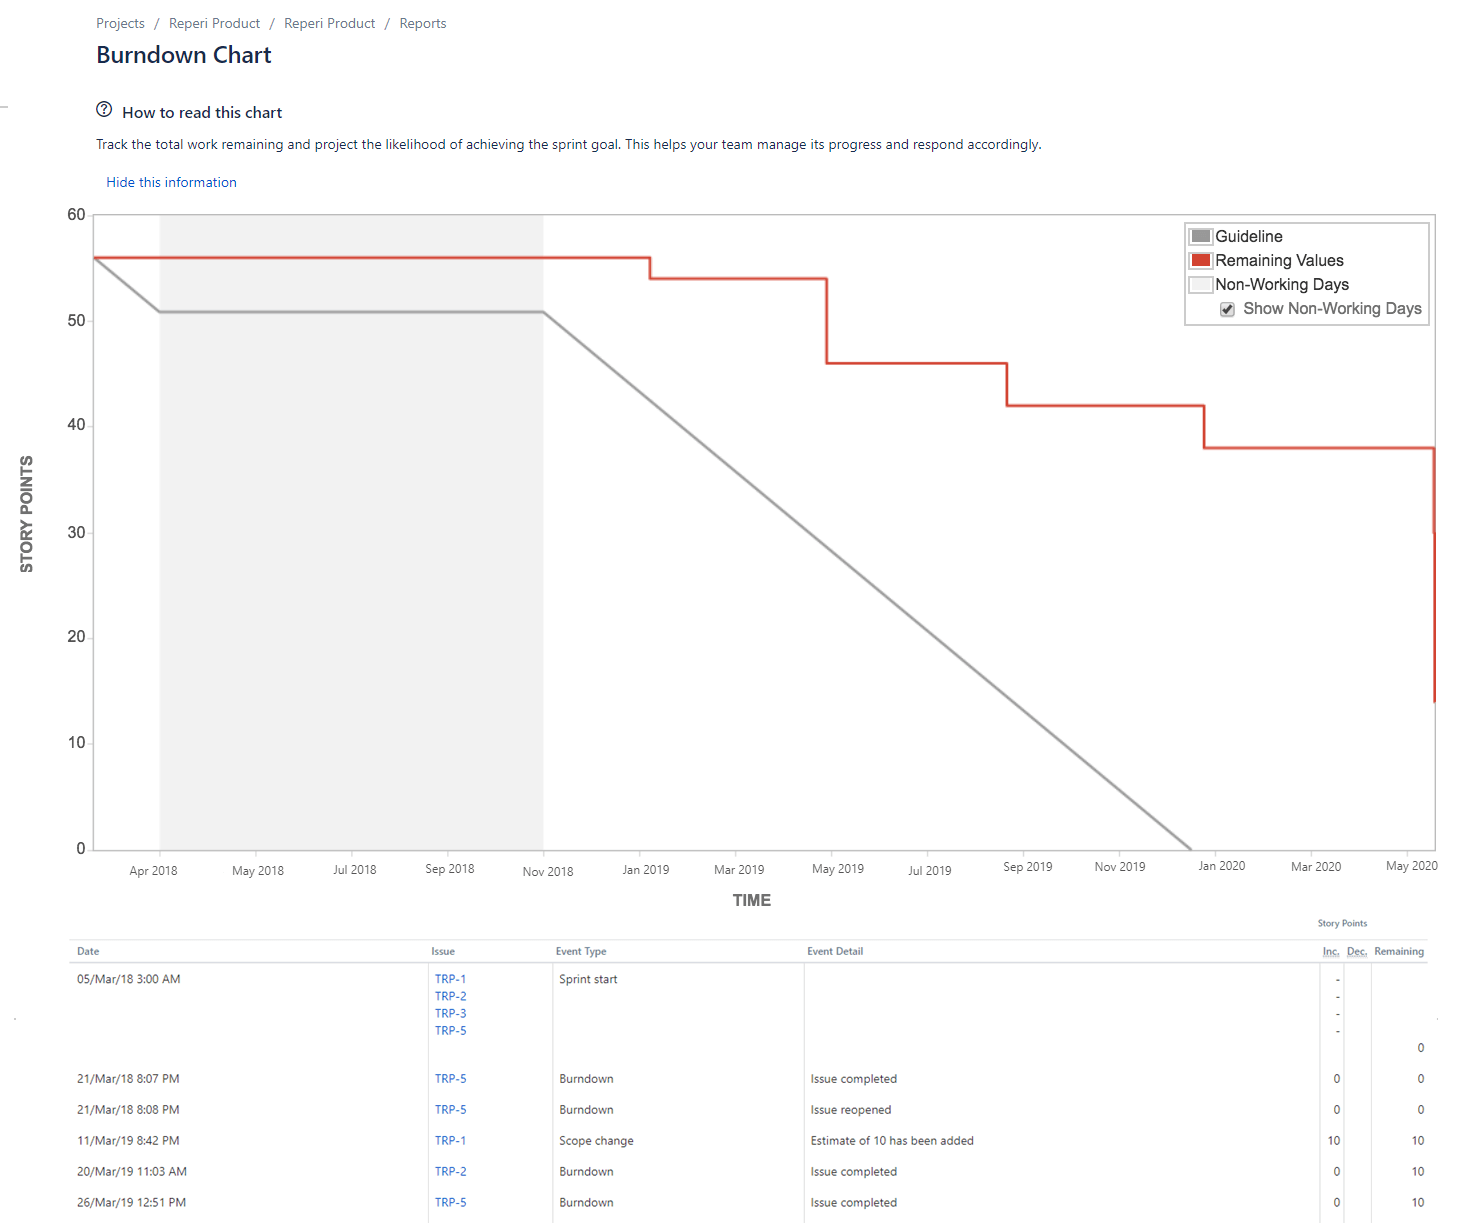
The Burndown chart is also useful for sprint planning. If the team keeps pace and confirms its speed every time, with the help of the reports you can determine how much work it can complete for each sprint.
Sprint Report in Jira
Sprint Report in Jira allows us to understand the amount of work, what goes by plan, and what does not in the sprint. This report will show the real status of tasks in a project, whether your team has overbooked tasks, or the work is being completed less than planned.
Very often there it’s needed to have reports for tracking user activity, work logs, and reports about epic progress. As we can see, Jira presents different reports for different needs, but sometimes they’re not enough and not as detailed as users’ needs, especially if we’re searching for resource reports.
ActivityTimeline and Reporting Facilities
While Jira provides mostly Jira project reporting for its users, the ActivityTimeline app‘s reports are mostly focused on Resources. ActivityTimeline is more focused on resource management & planning and has a variety of different reports with customizations for short and long periods of time.
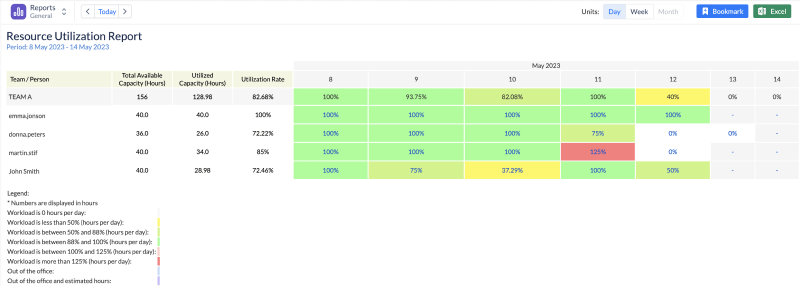
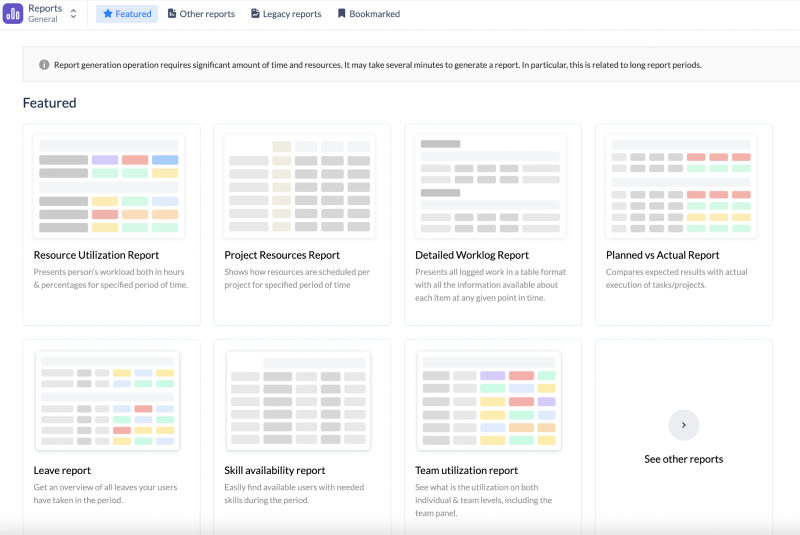
Resource Utilization Report
Resource Utilization Report presents a person’s individual workload both in hours & percentages for a specified period of time. This report is extremely useful as it shows the total workload of team members and avoids over-, or underload. Enjoy a proper visualization of the resources’ workload and effortlessly manage your teams.
Project Resources Report
Project Resources Report shows how resources are scheduled per project for a specified period of time. It is a high-level report and is very facilitative when you have numerous projects. It shows the number of hours and resources who are dedicated to the projects. The report clearly reflects team members’ involvement in different projects.

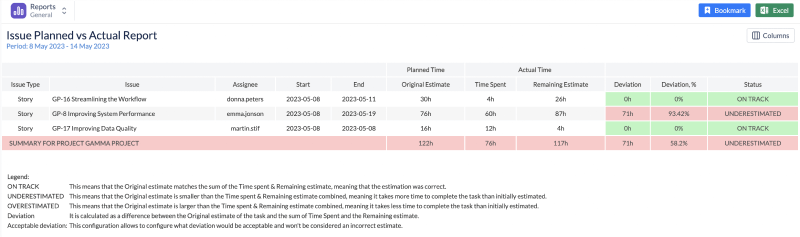
Planned vs Actual report
Planned vs Actual report compares expected results with actual execution of tasks/projects. It is very important to have such analysis because it shows if tasks and the project overall are getting estimated in the right way as well as whether there is any problem with a particular issue that is causing the whole project to deviate from the plan. This report allows us to analyze whether expectations are justified and to plan the workflow better in order to avoid waste of time and resources.
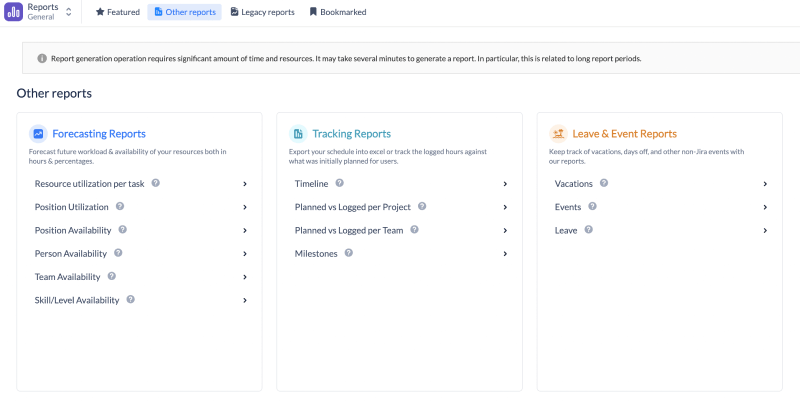
Reporting is a crucial part of efficient work and shouldn’t be neglected. ActivityTimeline offers a great variety of reports for the users’ convenience, starting from time tracking reports to reports with statistics for projects.
Plan and track with ease and ActivityTimeline.
Final Thoughts
Reports are an essential part of successful planning and good decision-making in any business. Jira Software offers users many types of reports to help track the progress made on projects. Additionally, plugins like ActivityTimeline in Atlassian Marketplace can provide users with advanced reports capabilities for resources and project data. It's important to take the time to evaluate each of your options, understand their features, and select the report that best suits your needs.
Discover more advantages for your teams here - Holiday Schemes Management with ActivityTimeline
FAQs about Jira Reports
How do I access Jira Reports?
To view and have access to Jira reporting, users have to select a Specific Project → choose Your project → Reports. Click the Report icon at the top left. It displays every report supported by Jira.
How do I generate a report in Jira?
To generate a report in Jira you need to first gather all relevant data needed to create your desired report. You can then configure the report using the Report Configuration Wizard which allows users to set filters and parameters so that only relevant information is shown in the final version of the report. Once configured you can then generate results either as an xls or web format.
What is the best reporting tool for Jira?
The best reporting tool for Jira depends on your specific needs. Some options include third-party tools such as Power BI (Microsoft), add-ons like ActivityTimeline, or customizing reports using the powerful features provided by Jira’s Report Configuration Wizard.


